


HyperDbg Debugger
 HyperDbg Debugger is an open-source, community-driven, hypervisor-assisted, user-mode, and kernel-mode Windows debugger with a focus on using modern hardware technologies. It is a debugger designed for analyzing, fuzzing, and reversing.
You can follow HyperDbg on Twitter to get notified about new releases, or join the HyperDbg Telegram group, where you can ask developers and open-source reversing enthusiasts for help with setting up and running HyperDbg.
Description
HyperDbg is designed with a focus on using modern hardware technologies to provide new features to the debuggers' world. It operates on top of Windows by virtualizing an already running system using Intel VT-x and Intel PT. This debugger aims not to use any APIs and software debugging mechanisms, but instead, it uses Second Layer Page Table (a.k.a. Extended Page Table or EPT) extensively to monitor both kernel and user executions.
HyperDbg comes with features like hidden hooks, which are as fast as old inline hooks, but also stealth. It mimics hardware debug registers for (read & write) to a specific location, but this time entirely invisible for both Windows kernel and the programs, and of course, without any limitation in size or count!
Using TLB-splitting, and having features such as measuring code coverage and monitoring all mov(s) to/from memory by a function, makes HyperDbg a unique debugger.
Although it has novel features, HyperDbg tries to be as stealthy as possible. It doesn’t use any debugging APIs to debug Windows or any application, so classic anti-debugging methods won’t detect it. Also, it resists the exploitation of time delta methods (e.g., RDTSC/RDTSCP) to detect the presence of hypervisors, therefore making it much harder for applications, packers, protectors, malware, anti-cheat engines, etc. to discover the debugger.
Build & Installation
You can download the latest compiled binary files from releases; otherwise, if you want to build HyperDbg, you should clone HyperDbg with the --recursive flag.
Please visit Build & Install and Quick Start for a detailed explanation of how to start with HyperDbg. You can also see the FAQ for more information, or if you previously used other native debuggers like GDB, LLDB, or WinDbg, you could see the command map.
Tutorials
The OpenSecurityTraining2's "Reversing with HyperDbg (Dbg3301)</strong>" tutorial series, available on OST2's website (preferred) and YouTube is the recommended way to get started with and learn HyperDbg. It guides you through the initial steps of using HyperDbg, covering essential concepts, principles, and debugging functionalities, along with practical examples and numerous reverse engineering methods that are unique to HyperDbg.
If you're interested in understanding the internal design and architecture of hypervisors and HyperDbg, you can read the Hypervisor From Scratch tutorials.
Publications
In case you use one of HyperDbg's components in your work, please consider citing our papers.
1. HyperDbg: Reinventing Hardware-Assisted Debugging (CCS'22) [arXiv]
2. The Reversing Machine: Reconstructing Memory Assumptions [arXiv]
You can also read this article as it describes the overall architecture, technical difficulties, design decisions, and internals of HyperDbg Debugger, this article about our efforts on vm-exit transparency, and this article about chasing bugs within hypervisors. More articles, posts, and resources are available at the awesome repo, and in addition, the slides repo provides presentation slides for further reference.
Unique Features
- Advanced Hypervisor-based Kernel Mode Debugger [link][link][link]
- Classic EPT Hook (Hidden Breakpoint) [link][link][link]
- Inline EPT Hook (Inline Hook) [link][link]
- Monitor Memory For R/W (Emulating Hardware Debug Registers Without Limitation) [link][link][link]
- SYSCALL Hook (Disable EFER & Handle #UD) [link][link][link]
- SYSRET Hook (Disable EFER & Handle #UD) [link][link]
- CPUID Hook & Monitor [link][link]
- RDMSR Hook & Monitor [link][link]
- WRMSR Hook & Monitor [link][link]
- RDTSC/RDTSCP Hook & Monitor [link]
- RDPMC Hook & Monitor [link]
- VMCALL Hook & Monitor [link]
- Debug Registers Hook & Monitor [link]
- I/O Port (In Instruction) Hook & Monitor [link][link]
- I/O Port (Out Instruction) Hook & Monitor [link][link]
- MMIO Monitor [link]
- Exception (IDT < 32) Monitor [link][link][link]
- External-Interrupt (IDT > 32) Monitor [link][link][link]
- Running Automated Scripts [link]
- Transparent-mode (Anti-debugging and Anti-hypervisor Resistance) [link][link]
- Running Custom Assembly In Both VMX-root, VMX non-root (Kernel & User) [link]
- Checking For Custom Conditions [link][link]
- Process-specific & Thread-specific Debugging [link][link][link]
- VMX-root Compatible Message Tracing [link]
- Powerful Kernel Side Scripting Engine [link][link]
- Support To Symbols (Parsing PDB Files) [link][link]
- Mapping Data To Symbols & Create Structures, Enums From PDB Files [link][link][link]
- Event Forwarding (#DFIR) [link][link]
- Transparent Breakpoint Handler [link][link]
- Various Custom Scripts [link]
- HyperDbg Software Development Kit (SDK) [link]
- Event Short-circuiting [link][link]
- Tracking records of function calls and return addresses [link]
- Kernel-level Length Disassembler Engine (LDE) [link][link]
- Memory Execution Monitor & Execution Blocking [link]
- Custom Page-fault Injection [link]
- Different Event Calling Stages [link]
- Injecting Custom Interrupts/Exceptions/Faults [link][link]
- Instant events in the Debugger Mode [link]
- Detect kernel-to-user and user-to-kernel transitions [link]
- Physical memory monitoring hooks [link]
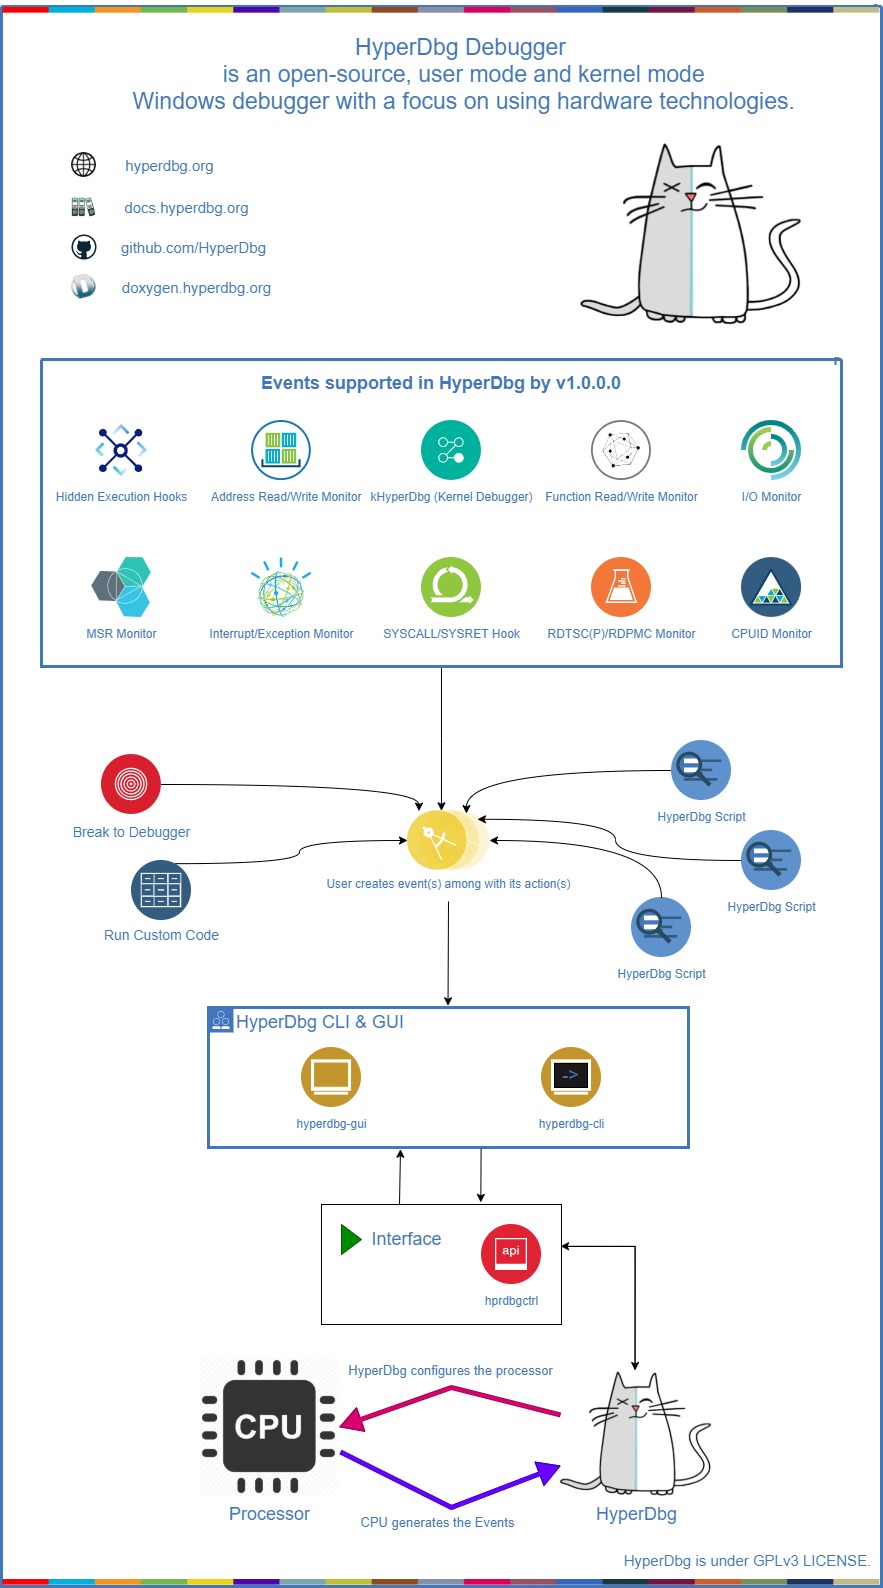
How does it work?
You can read about the internal design of HyperDbg and its features in the documentation. Here's a top-level diagram that shows how HyperDbg works:
Scripts
You can write your scripts to automate your debugging journey. HyperDbg has a powerful, fast, and entirely kernel-side implemented script engine.
Contributing
Contributing to HyperDbg is super appreciated. We have made a list of potential tasks that you might be interested in contributing towards.
If you want to contribute to HyperDbg, please read the Contribution Guide.
License
HyperDbg, and all its submodules and repos, unless a license is otherwise specified, are licensed under GPLv3 LICENSE.
Dependencies are licensed by their own.